Green Lights, Red Reality: Why Your Network Metrics Are Lying to Your Users
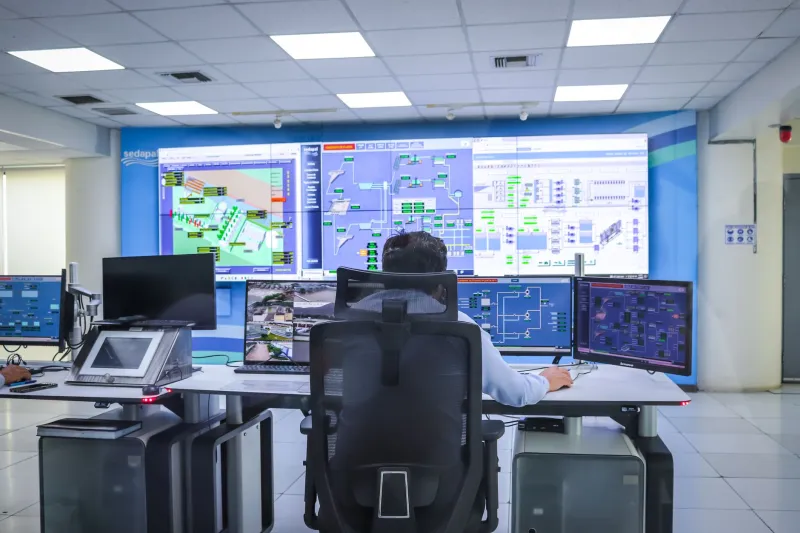
There is a particular kind of organizational frustration that surfaces when a help desk ticket reads "everything is slow" and the network operations center responds with a screenshot full of green indicators. The tools say nominal. The users say otherwise. Somewhere between those two positions lies a failure that most enterprises have not yet learned to name, let alone solve.
This is the latency mirage in practice: a condition in which measured performance and perceived performance occupy entirely separate realities, and where optimizing for the former can actively worsen the latter.
What the Dashboard Cannot Feel
Enterprise monitoring platforms are sophisticated instruments. They capture packet loss, round-trip times, jitter, and throughput with considerable precision. What they cannot do is replicate the cognitive and contextual experience of a sales engineer in Chicago waiting for a CRM screen to populate before a client call, or a warehouse supervisor in Memphis whose inventory application hesitates just long enough to break operational rhythm.
Perceptual latency—the delay as experienced by a human being in a specific workflow context—is shaped by factors that traditional telemetry rarely captures in combination. Application response sequencing, browser rendering behavior, middleware processing queues, and even the cadence of user interaction patterns all contribute to what a person registers as "fast" or "slow." A network that delivers packets in 12 milliseconds may still feel sluggish if the application layer introduces variable processing delays that create an uneven, stuttering rhythm.
The instrumentation gap is not a flaw in the tools themselves. It is a flaw in the assumptions underlying how those tools are deployed and interpreted.
The Laboratory Condition Problem
Benchmark environments are, by design, controlled. Traffic is synthetic, endpoints are predictable, and load profiles are engineered to stress specific variables while holding others constant. These conditions are valuable for capacity planning and baseline establishment. They are poor proxies for production reality.
In production, a financial services firm in New York might see its trading desk application perform flawlessly during off-peak hours—well within SLA thresholds—while degrading meaningfully during the 90-second window around market open when user concurrency spikes, DNS resolution contention increases, and authentication services queue. The benchmark never captured that 90-second window. The SLA never defined it. The users experience it every morning.
Similarly, geographic distribution creates performance asymmetries that synthetic testing rarely replicates. A healthcare organization operating across multiple regional facilities may instrument its core data center connections with precision while remaining entirely unaware of the last-mile variability affecting clinicians on hospital floors who share wireless segments with patient-facing IoT devices.
The lesson is not that benchmarking is worthless. It is that benchmarking without production correlation creates a false confidence that quietly accumulates into user experience debt.
Closing the Perception Gap
Bridging the distance between measured and experienced performance requires a deliberate shift in instrumentation philosophy. Several architectural and operational changes are enabling more progressive network teams to make this transition.
Synthetic transaction monitoring in production context. Rather than relying exclusively on passive telemetry, leading organizations are deploying agent-based synthetic monitoring that simulates actual user workflows—login sequences, data retrieval patterns, form submissions—from endpoints distributed across the real production environment. This approach surfaces application-layer latency contributions that pure network metrics obscure.
User-reported signal integration. Structured mechanisms for collecting user experience feedback—embedded satisfaction signals, session performance flags, or lightweight client-side instrumentation—create a qualitative data layer that correlates with, and sometimes contradicts, quantitative telemetry. When these signals diverge from dashboard indicators, the divergence itself becomes diagnostic information.
Percentile-based performance analysis. Average latency is a deeply misleading metric for user experience assessment. A network delivering an average round-trip time of 20 milliseconds may be delivering 200-millisecond responses to the 95th percentile of users—the very users most likely to escalate complaints. Shifting SLA definitions toward 95th and 99th percentile thresholds forces instrumentation to surface the tail-end behavior that averages conceal.
Application-aware monitoring integration. Network performance does not exist in isolation from application behavior. Integrating network telemetry with application performance management data allows operations teams to distinguish between network-introduced latency and application-processing delay—a distinction that is essential for directing remediation effort accurately.
The Organizational Dimension
Technical instrumentation improvements are necessary but insufficient if the organizational structures around them remain unchanged. In many enterprises, network operations and application teams maintain separate tooling stacks, separate escalation paths, and separate performance definitions. A user complaint that traverses this divide often loses fidelity with each handoff, arriving at the responsible team as a vague performance ticket that neither group feels empowered to own.
The enterprises making meaningful progress on the perception gap are those investing in shared observability platforms that give network, application, and infrastructure teams a common operational picture. They are also redefining what "performance" means at the organizational level—moving from infrastructure-centric metrics toward outcome-centric ones that reflect what users actually need to accomplish their work.
What Is at Stake
User experience degradation that goes unmeasured does not go unfelt. Research consistently links application performance to productivity outcomes, employee satisfaction, and—in customer-facing contexts—revenue and retention. An enterprise whose network passes every internal benchmark while quietly frustrating its workforce is not operating at the performance level its instrumentation suggests.
The latency mirage is, at its core, a measurement problem with a human cost. Solving it requires expanding the definition of network performance beyond what current tooling was built to capture—and accepting that the most important performance metric may be the one your dashboard has never displayed.